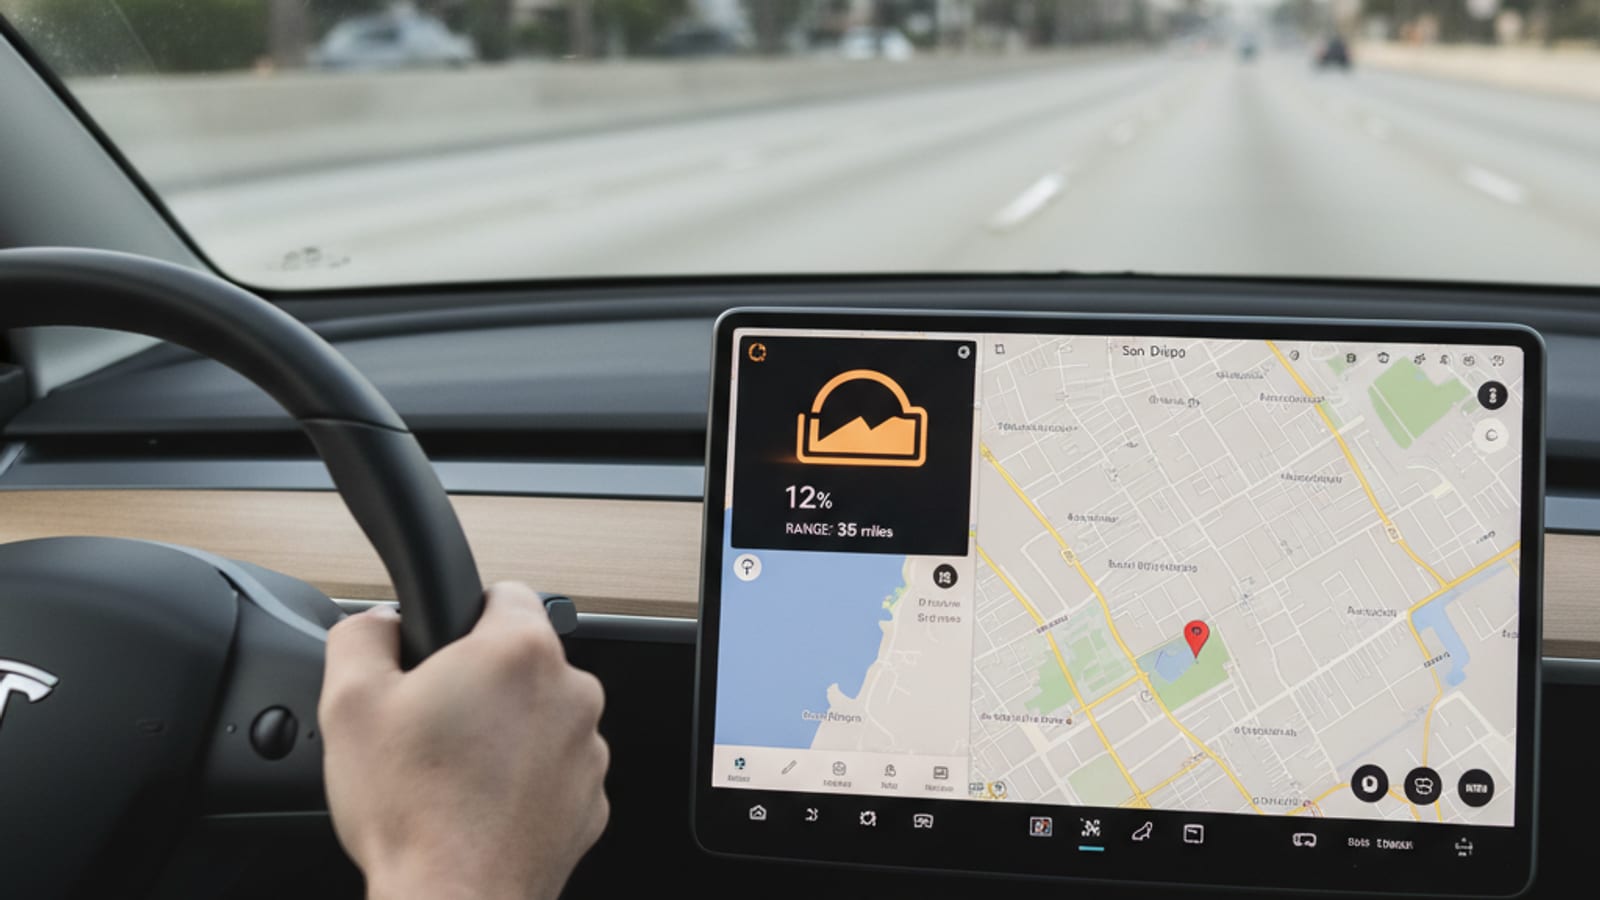
Range anxiety in Orange County has a number in the state file. CEC’s year-end 2025 counts put 260,833 zero-emission vehicles on county roads. The same charger file lists 7,095 public ports. That’s 36.8 ZEVs for every public port. California’s statewide ratio, from those files, is 24.4. More cars share each public plug here than statewide.
What the 2025 vehicle file puts on the road
As of December 31, 2025, Orange County’s light-duty fleet was 2,469,737 vehicles. Battery-electric cars and trucks accounted for 210,842 of them. Plug-in hybrids added 47,567, and fuel-cell vehicles added 2,424. ZEVs were 10.56% of the county light-duty fleet. Battery-electrics alone were 8.54%.
California’s ZEV share in that file was 7.54%. Orange County holds 12.02% of the state’s battery-electric vehicles. It’s only 8.33% of the state’s light-duty fleet. That mismatch is why a stall here can feel busier than the state story.
The California DMV’s county report, as of January 1, 2026, lists 2,983,348 total registrations. That count includes trailers and motorcycles. Don’t divide CEC’s ZEV total by the DMV figure. The 36.8 ratio uses CEC vehicles and CEC public ports, both from December 31, 2025.
New ZEV sales stay ahead. They’re not taking off.
CEC’s new-sale files, current through June 30, 2026, still show Orange County above the state. ZEVs were 28.76% of new light-duty sales here in 2025. California’s figure that year was 22.93%. In 2026 Q2, Orange County was 24.77% and California was 19.09%.
The lead is steady, about five to six points. The trend isn’t a boom. California’s ZEV share of new sales peaked at 25.31% in 2024. 2026 Q1 was the weakest quarter in the series, at 15.76% statewide. Orange County’s Q1 share was 20.22%. CEC changed its new-sale method in 2023 and again in 2025. Comparisons that jump those years aren’t clean.
Orange County still accounts for about 12% of California’s new ZEV sales. The share was 12.43% in 2025 and 12.07% in 2026’s first half.
Tesla’s share of the fleet, and of new plates
Tesla makes up 138,121 of Orange County’s 210,842 battery-electrics as of year-end 2025. That’s 65.51% of the county BEV fleet. It’s 5.59% of all light-duty vehicles here. Statewide, Tesla is 61.34% of BEVs. Orange County sits 6.4 points more Tesla-concentrated than California.
Tesla’s share of county ZEV sales was 56.9% in 2023. It fell to 47.2% in 2024 and 44.7% in 2025. The first half of 2026 returned to 56.4%. Other brands are a real part of this fleet. A Supercharger isn’t the only plug on the map.
The port file behind 36.8
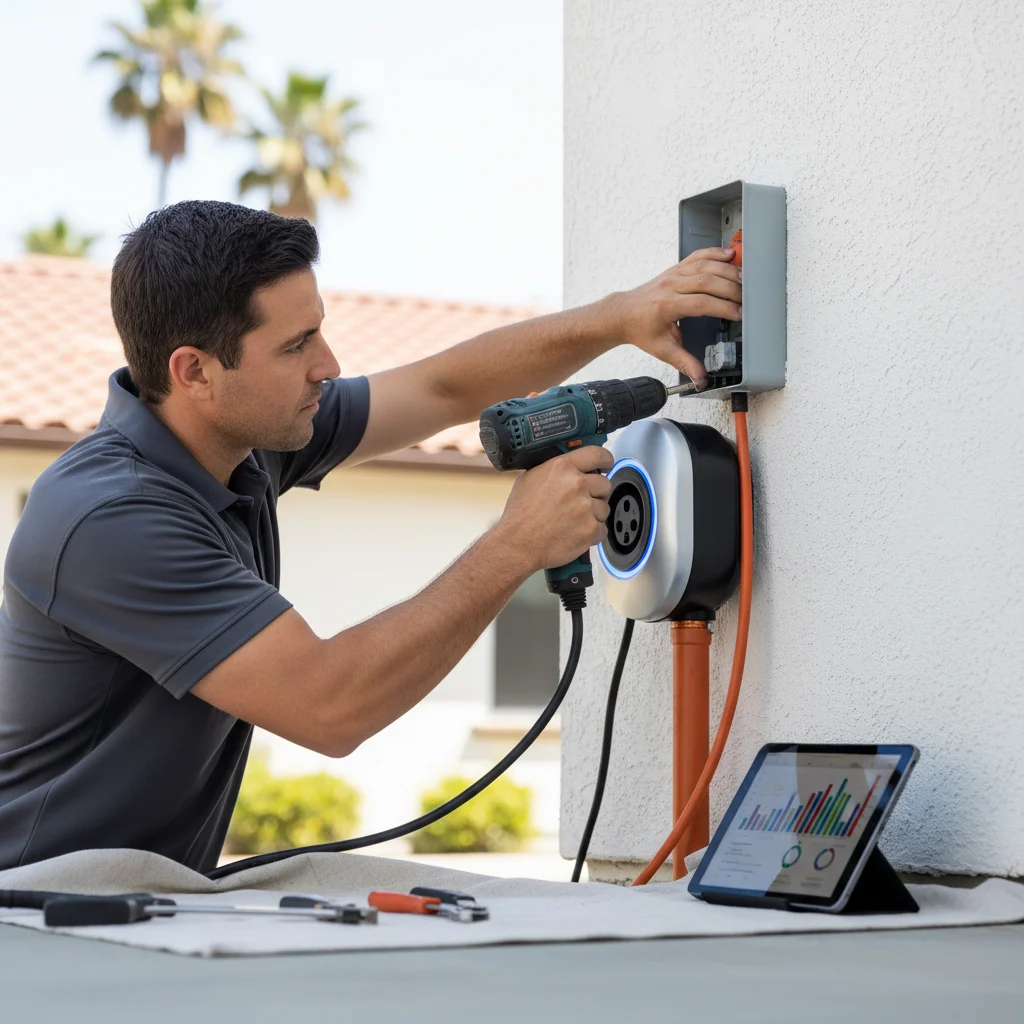
CEC’s charger file for December 31, 2025 lists 20 public Level 1 ports in Orange County. It lists 5,600 public Level 2 ports and 1,475 public DC fast ports. Public ports total 7,095. Shared-private Level 2 adds 4,621, and shared-private DC fast adds 64, for 4,685. Public plus shared private is 11,780.
California had 91,520 public ports. Orange County holds 7.75% of that network. That sits next to a 12.02% share of state BEVs. The 36.8 versus 24.4 ratio is the result. Orange County is materially worse served per EV than the state average, on public ports. CEC compiles ports from surveys, grant lists, AFDC, PlugShare, and other listings. It updates that file twice a year.
The 36.8 figure uses public ports only. A workplace or HOA stall helps if you can reach it. It doesn’t help a car already sitting on the shoulder.
Fast plugs the AFDC record actually names
AFDC data for Orange County counts 48 Tesla Supercharger sites and 861 DC fast ports. All public DC fast charging in the county is 223 stations and 1,452 ports. Without Tesla, that’s 175 stations and 591 DC fast ports. Tesla holds 59% of Orange County’s public DC fast ports.
ChargePoint has the most sites, 71, and only 76 DC fast ports. Many are dealership and office singles.
Irvine’s Supercharger at 1920 Main St has 40 stalls, rated 250 kW in AFDC. Garden Grove’s 12891 Harbor Blvd site has 32 stalls. San Clemente’s 101 W Avenida Vista Hermosa site has 49 stalls. Santa Ana’s 1008 17th St site has 28 stalls at 325 kW. Tustin’s 14661 Franklin Ave site has 36 stalls. Buena Park’s 8888 Knott Ave site has 28 stalls at 325 kW.
Not every Tesla bank is that fast. Westminster Mall lists 24 stalls at 75 kW. Tesla lists The Shops at Mission Viejo at 10 stalls, up to 72 kW. AFDC power ratings aren’t always the figure Tesla publishes.
Lake Forest’s Magic Dock at 24372 Rockfield Blvd lists 16 stalls at 325 kW. It carries CCS1 and NACS. Huntington Beach has 24 stalls at 6913 Warner Ave.
Non-Tesla DC fast is smaller, and it’s on the map. Electrify America lists 12 DC fast ports at 25825 Las Vegas in Capistrano Beach. That’s the largest non-Tesla site in south county in the AFDC pull. The Euclid Walmart in Anaheim lists 10. Fashion Island in Newport Beach lists 8. EVgo lists 14 DC fast ports at Plaza Antonio in Rancho Santa Margarita. Ocean View Plaza in San Clemente lists 10. Westar Mercantile East in Ladera Ranch lists 8.
Those records name sites. They don’t tell you a stall is open. If an Anaheim bank is packed, start with our note on full Superchargers. City-by-city pages live on the Orange County charging hub.
Why the ratio shows up in the driver’s seat
EPA range is a lab number. An Orange County day isn’t. A long stop in an Anaheim theme-park lot runs climate control while the car sits. The crawl back onto I-5 spends energy in heat and low speed. A coastal grade after Huntington Beach or Newport Beach asks for climb and cooling together. Inland streets toward Yorba Linda add the same kind of draw.
If you can’t plug in overnight in Santa Ana, you’re on those 7,095 public ports. Same story in Garden Grove. A home-charged Tesla in Irvine isn’t. The CEC file can’t split those two drivers. It can tell you the public network carries more ZEVs per port than California.
Tesla’s Model Y owner’s manual on running out of range is the technical piece. Once the high-voltage pack is exhausted, the low-voltage battery can lose support. The car may need external power before the pack will accept a charge. An empty EV can be two problems at once. Apps that show live stalls help before you’re that low. Our charging-app rundown is the pre-strand checklist. For daily miles, see how long a Tesla charge lasts through an Orange County day.
When the pack is already at zero
Tesla’s roadside-assistance page wasn’t opened directly in this research run. Search listings of Tesla’s own copy describe depleted-battery help as assistance, not a covered service. Covered 500-mile transport is for a warrantable breakdown that leaves the car undrivable. Running out of charge sits outside that. Tesla’s published path is transportation, not a charge at the bumper. Open Tesla’s roadside page and confirm the current wording before you count on a dispatch. Tesla’s roadside number, as published on the Santa Ana service page, is 877-798-3752.
If you’re already on a freeway shoulder, stay in the car if it’s safe. Keep hazards on, and don’t walk for a stall. Our guide for an empty pack on an Orange County freeway is the sequence. Out-of-charge recovery is the page for a charge at the car.
Charge Pro OC is a referral line. We match stranded EV drivers with independent local operators. We don’t own trucks, and we don’t set prices. The operator quotes you before work starts and bills you directly. The pros we send bring a 240V Level 2 source to the car. They use a native NACS plug, plus CCS or J1772 adapters for other brands. They typically add 10 to 20 miles in 15 to 30 minutes of charging. That window is charging time, not an arrival time.
Mobile EV charging covers lots, driveways, and garages an operator can reach. We serve every city in the county. If you want a local operator on the line, call (949) 444-0151. We’ll connect you. The quote comes from the operator, not from us.
Frequently asked questions
How crowded are Orange County’s public ports versus California’s?
Use the CEC year-end 2025 files. Orange County has 260,833 ZEVs and 7,095 public ports. That’s 36.8 ZEVs per public port. The state ratio is 24.4. The county holds 12.02% of California’s battery-electrics and 7.75% of its public ports. That mismatch is the crowding.
Do the 2026 sales numbers mean range anxiety is fading?
They don’t. Orange County still sells ZEVs at a higher share than the state. That’s 24.77% versus 19.09% in 2026 Q2. The statewide ZEV share of new sales is down from the 2024 peak. CEC broke its sales method in 2023 and 2025. Don’t treat every year-over-year jump as a clean trend. More cars still share those public ports.
What should I do if the pack hits zero on an Orange County road?
Get to a safe shoulder, or stay in a legal space. Keep hazards on, and don’t walk the freeway for a stall. Tesla roadside, if you call it, is set up for transport on a depleted pack. It isn’t an on-site charge. A local operator can bring 240V to the car. That typically adds 10 to 20 miles in 15 to 30 minutes of charging.